
This year’s changes ushered in by the iOS 14.5 update and the complications they triggered remain one of the most burning issues in mobile. Many have already experienced all the limitations related to the launching of SKAdNetwork (SKAN) campaigns. And it has certainly become a popular opinion that “campaigns on 14.5+ simply don’t work”. Now, however, it seems only logical to pose a counter-question: Do you measure the profitability of SKAN campaigns correctly?
We’ll take a look at major approaches to analyzing SKAN campaigns shortly. But first, let’s briefly discuss two main problems that prevent us from correctly assessing campaign ROAS.
Problem #1: The 24-hour ‘event’ timer
You can send events to SKAdNetwork within the first 24 hours, which greatly limits the performance evaluation of any advertising campaign. It’s not that bad if, for instance, you have an annual trial-free subscription and most of your purchases happen during the onboarding. But how can you properly estimate the ROI when you have:
a) a trial model with purchases on WW (where the trial-to-pay conversions vary greatly depending on GEO/channel)? Let’s say we manage to send the trial event to SKAN. Then, however, we can only guess how the trial-to-pay conversion actually came to be and what was its revenue. We no longer see this data in the context of channels and campaigns.
b) multiple subscription buttons on a paywall? While the distribution of configurations can significantly change LTV depending on GEO/channel?
c) different prices for different GEOs, and SKAN does not provide country-by-country data?
“Alright,” thinks the head of ua/CMO/UA, “let’s somehow calculate the average LTV and trial-to-pay conversions and start predicting.” It might sound like a plan, but unfortunately, we are just bound to face a different problem:
Problem #2: Random delays in event postbacks in SKAN campaigns
If Apple’s privacy threshold is not respected, some of the postback events will simply not be included in the campaign.
Often advertisers know for sure that some of the event postbacks don’t follow through (while the organic growth in the purchased geo is observed), but they don’t know exactly which part it is and which campaigns/channels triggered them. Different teams use different approaches to solve the problem with “pseudo” organic installs distribution across channels and campaigns.
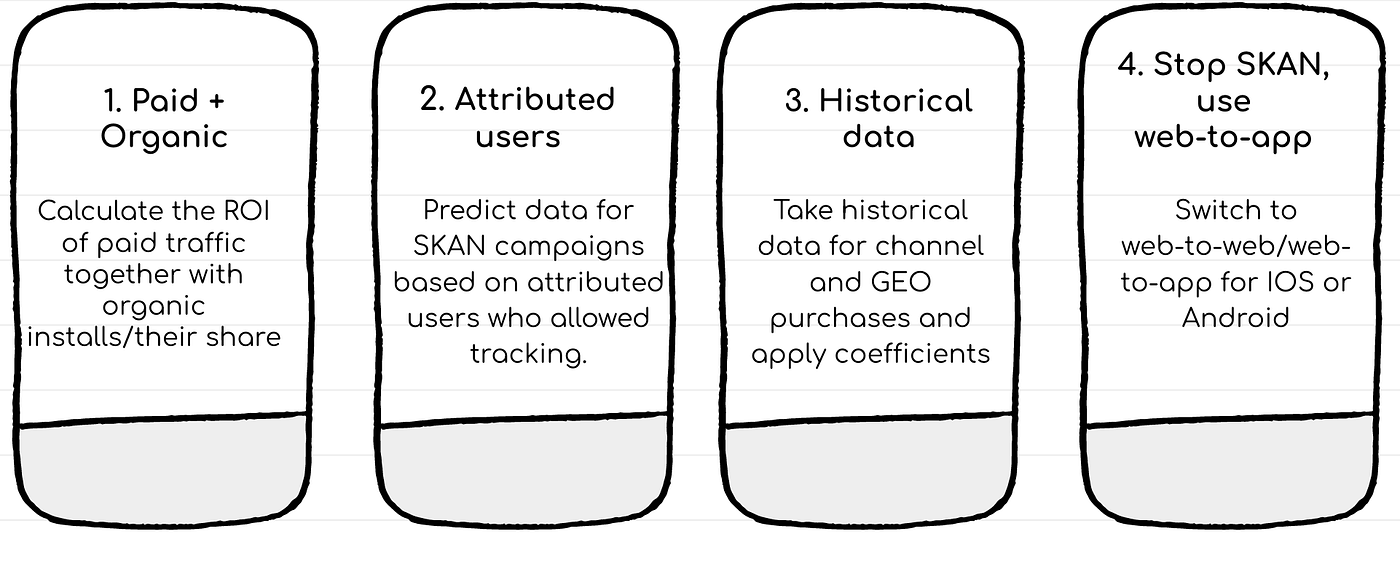
Approach #1: Calculate the ROI of paid traffic together with organic installs/their share
Most likely, this approach can work quite decently when purchasing 1 channel on GEO and a small share of organic installs. But as soon as you connect the 2+ channels to the same geo, sorting out organic installs can be plain hard. The measured organic uplift (alternative activation of a paid traffic channel on GEO and measuring the organic installs growth) on one geo can differ from another + can significantly vary from period to period + will definitely vary depending on the channel.
Approach #2: Predict data for SKAN campaigns based on attributed users who allowed tracking.
Simply put: we take the install-to-subscription conversion of the attributed users and apply it to the SKAN installs. This method works if: a) the share of the users who permitted tracking is high and there is enough data on purchases by the attributed users; b) we assume that attributed and unattributed users behave in the same way (spoiler alert: too often this is not the case); c) there is a stable country-by-country distribution within the channel/campaign. As a rule, all of the above conditions rarely coincide.
Approach #3: Take historical data for channel and GEO purchases and apply coefficients (e.g., install-to-trial and install-to-paid) to 14.5+ campaigns.
According to our data, the values of CPM, CPI, CR% Install → Trial / Paid significantly differ between SKAN and non-SKAN campaigns, which can be explained by the changes in algorithms, the complexity of targeting in the ad networks themselves, and competition.
Approach #4: Switch to web-to-web/web-to-app for IOS or Android.
Seems to be the most accurate approach of all 🙂
Our solutions for SKAN campaigns analysis
We understand why these approaches have the right to exist — after all, we all need to measure economic performance under the new conditions. However, we do realize the limitations, inaccuracy and inconvenience of the above listed approaches. And so, the time has come to share with you how we help our clients measure profitability of their SKAN advertising campaigns and what data we provide on our BI platform.
Problem #1: The 24-hour ‘event’ timer
Our clients often use trial models or different pricing options on a paywall and a large variety of channels and GEO for purchasing, and that’s the main reason why we have to consider the following:
- trial-to-pay conversions vary widely for different GEO/channels;
- subscription distribution, as well as LTV, might vary significantly for different GEO/channels;
- SKAN doesn’t provide event data in the сontext of GEO.
Solution:
For our clients we produce a prediction of the user’s LTV over the required period (e.g., for 1 year) within the first 24 hours and send it to SKAN as a conversion value. Thus, the UA team is able to see (in BI and MMP as well as in the ad networks themselves) not just a completed trial and purchase event, but also a predicted eRevenue and ROAS in the context of campaigns and channels. In our predictions we use the data on events completed by the user, GEO and predictive extensions.
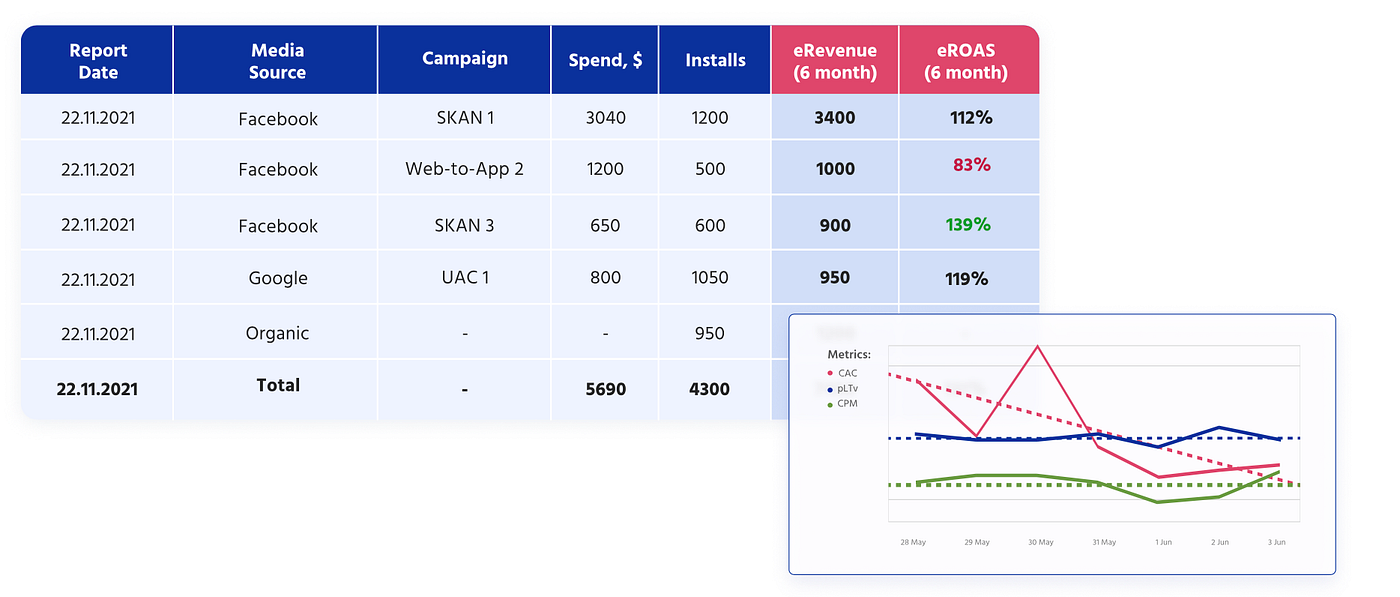
Sending predicted eRevenue (compared to sending just the fact of a completed trial/purchase) significantly increases the level of accuracy and accelerates the decision-making processes, while also allowing launching RAOS optimized campaigns.
Problem #2: Random delays in event postbacks in SKAN campaigns
Having sent user’s predicted revenue data to Conversion Value, together with our clients we tested all of the approaches to SKAN performance evaluation listed above. In the end, we abandoned the idea of guessing how much, in which geo and to which campaigns we should redistribute the organic installs in question, because of high probability of errors and bad decisions. Instead of working with ephemeral coefficients, we chose to go for something more palpable — SKAN postbacks.
Solution:
We receive all SKAN postbacks using only our own resources, and redistribute eRevenue from delayed postbacks by campaigns. On average we see around 20% Revenue shortage across all channels, but the most interesting thing, however, is the postbacks shortage between channels and campaigns. Campaigns with the same amount of installs (which exceed network threshold) might have from 3% to 30% of eRevenue shortage, which admittedly are significant numbers for purchasing.
Find out more about the calculation method and our results in the Demo of our BI platform Predicted.io.

Solutions for SKAN campaigns is just one of the many modules on our platform. Predicted.io is a full-fledged marketing analytics platform which predicts 1-month/ 2-month/ 6-month/ 1-year/ 2-year acquired user revenue. If your team is looking for ways to automate LTV reports and recalculation, and your goal is to make prompt and accurate marketing decisions, please fill out an application on our website Predicted.io or contact us at info@predicted.io. We are always happy to tell you more about our platform and address all of your questions.